
For decades, the multi-billion dollar testing industry has centered itself in schools. Despite objections from educators and students and the nauseating number of assessments that occur each year, the financial interests of Pearson, Curriculum Associates, and the like, continue to press a need for additional profits to please their shareholders or board members.
The advent of learning loss is connected to the “need” for more assessment. In the wake of pandemic schooling, the testing industry has seen an opportunity to establish additional professional development, coursework, and assessment measures to line their pocket-books. This language has taken hold, with numerous organizations rallying to demand solutions to the “unresolved learning” of the 2020-2021 school year. Yet, this data is ineffectual. Upon close examination, we begin to understand that perhaps “learning loss” is built on a lie.
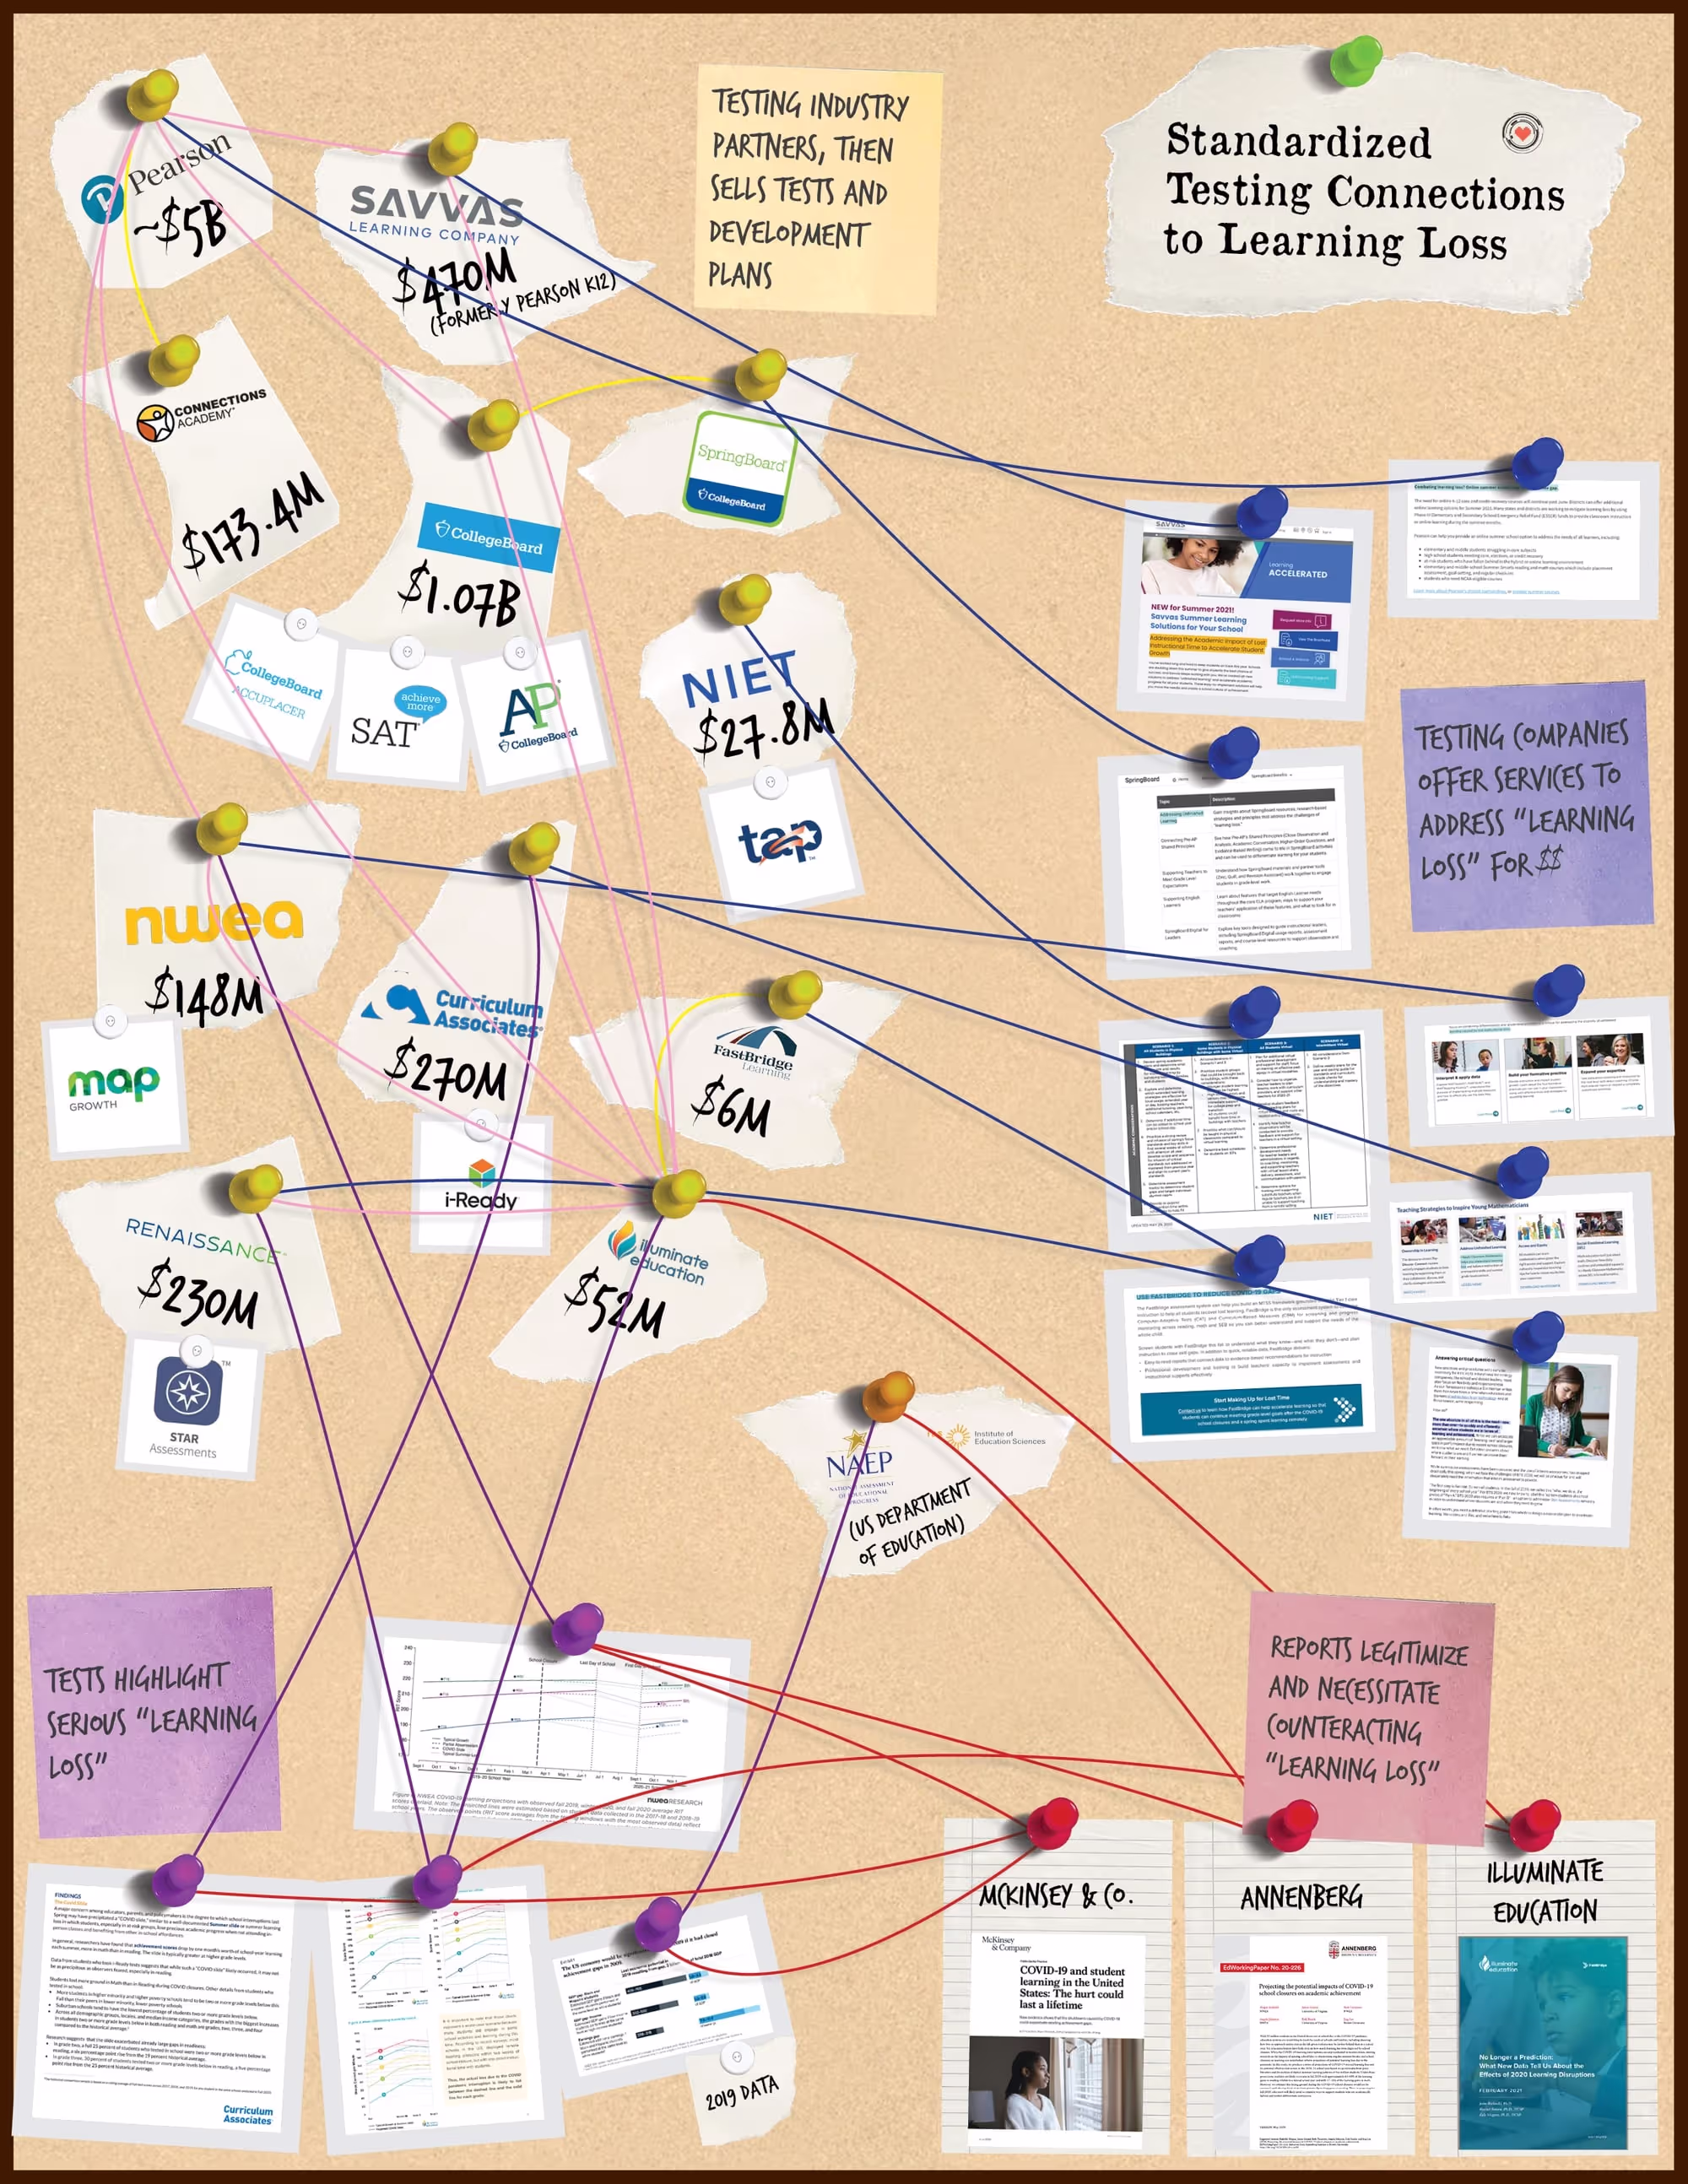
Reading the Diagram
The above diagram demonstrates nefarious connections between the testing industry, worrying reports about learning loss, and products sold to counteract the problem. In other words, the problem is being invented to sell the solution.
Seeing the Connection
Here’s the Secret: The Data Isn’t Conclusive
When we examine the limited reports that this entire facade is based on, we begin to see the illusion for profit. We’ll begin with the Illuminate Education/Fastbridge report: “No Longer a Prediction: What New Data Tell Us About the Effects of 2020 Learning Disruptions.” Huff, 2020No Longer a Prediction: What New Data Tell Us About the Effects of 2020 Learning DisruptionsView source → Illuminate Education offers a host of measurement scopes and sequences, and partners with many other testing companies to publish and work with their data. Further, they own the testing company Fastbridge.
All reports hone in on mathematics and reading scores. These graphs demonstrate:
In this series of graphs, we see 1st grade aMath (Fastbridge) scores. The Y-axis is the predicted aMath score, the X-axis is the student’s free/reduced lunch amount, and the lines represented the 2018-2019 or 2019-2020 school year. For example, a student with entirely free-reduced lunch in an urban school environment received a predicted score of ~197, whereas in the prior year they received a 200, a 3 point difference.
Importantly, this is the largest gap in the entirety of Fastbridge’s data. A similar student on third grade aReading, which uses a wider scale (scores average at 510), saw a ~1-2 point drop year-to-year. In fact, all data presented by Fastbridge shows less than a 3 point drop.
Further, Illuminate Education highlights MAP and STAR data. In analyzing MAP data, they find a drop in the national percentile between “0 to 3 percentile points”, which they explain away as an analytics error by NWEA.
This data is translated to a call to make up multiple months of “lost time.” The translation of percentile points to months of learning is entirely based on Illuminate Education’s opinion of “negligible” and “moderate” loss.
Similar results are found in “COVID-19 and Student Learning in the United States: The Hurt Could Last a Lifetime,” published by McKinsey & Company – the worldwide, massive consulting firm often involved in government services and foreign relations. Dorn et al., 2020COVID-19 and Student Learning in the United States: The Hurt Could Last a LifetimeView source → This report, and others by McKinsey, are widely circulated to prove the need to address “learning loss.”
The report primarily references testing data through NWEA MAP results:
This graph shows the amount of predicted “learning loss” in different scenarios entering the 2020-2021 school year. There are four scenarios:
- Students learn as normal through in-class instruction.
- 52% learning growth occurs through remote instruction. (This is entirely assumed.)
- No growth or loss occurs through remote instruction. (Again, assumed.)
- No instruction occurs. (Which did not happen in the United States.) Therefore, using NWEA’s own data, we can make a prediction of how much learning was “lost.” If we assume that somewhere between 52% and 100% “learning occurred”, then test scores dropped somewhere between 0 and 5 points, or 2% on the RIT scale. A RIT score is determined by adaptive learning software, equating to when a student is marking 50% of their answers correctly. In other words, this score difference is the equivalent of a few missed questions. This is similar to the findings presented by Illuminate Education on MAP scores.
Similar data is referenced in Annenberg Institute at Brown University’s “Projecting the Potential Impacts of COVID-19 School Closures on Academic Achievement,” which is co-authored by NWEA. Kuhfeld et al., 2020Projecting the Potential Impacts of COVID-19 School Closures on Academic AchievementView source → Researchers used models of natural disasters, forced school closings, traditional online schooling, and “summer slide” analytics to predict the amount of learning loss due to COVID-19. Namely, they rest their analytics on MAP growth data, which can be found in “The COVID-19 Slide: What Summer Learning Loss Can Tell Us About the Potential Impact of School Closures on Student Academic Achievement.” Kuhfeld et al., 2020The COVID-19 Slide: What Summer Learning Loss Can Tell Us About the Potential Impact of School Closures on Student Academic AchievementView source →
Here, we see three lines demonstrating the trajectory of “lost learning” over the summer, “COVID slowdown” and “COVID slide.” COVID slowdown assumes that students simply maintained the same scores since March 15th, with schools resuming in the fall. COVID slide assumes that students showed the same pattern as the summer. In other words, the COVID slide assumes that schools shut down after March 15th.
Therefore, using NWEA’s data we can assume that “learning loss” falls somewhere between a typical last day and a “COVID slide”, considering that schools in the US remained open through some form of remote or virtual learning. At its worse (3rd grade mathematics), this would be between 0 and 10 points. For other grade levels the loss is much less, such as 7th grade mathematics being less than 5 points. Reading scores were much closer.
Much Ado About Nothing
There’s no denying that the trauma of the pandemic will leave a lasting impact on students, educators, and their families for time to come. Most schools were ill-equipped or trained to handle remote instruction. Educators struggled to reach students and it was difficult to engage learners out of the classroom. Yet, to pretend that the need for improvement lies in test scores is a farcical notion rooted in generating income for testing companies.
According to MAP, iReady, and STAR data, of which almost all mainstream reports of learning loss are evidenced, there is little difference between previous test scores and predicted ones. Even taking this data at face value, where these companies make models that assume absolutely no instruction occurred after March 2020, the percentile difference is relatively minor year-to-year.
In fact, it is proactive for testing companies to make a rallying cry for “lost learning” to increase their profits. As evidenced, these companies claim that districts must complete additional assessments to ensure they know what students have lost, and then offer solutions and professional development to “bridge the gap.” The Department of Education’s Institute of Education Sciences announced “Operation Reverse the Loss,” which seeks to understand how serious learning loss is and invest millions in solutions, such as adaptive learning software and intensive tutoring (both heavily focused on by testing companies.) Schneider, 2020Operation Reverse the Loss, ReduxView source → Schneider, 2021The Road to Learning RecoveryView source →

In other words, testing companies seek to gain tens to hundreds of millions of dollars based on predictive models demonstrating a few point difference in scores. Through the American Rescue Act, states must invest 20% of their additional funding to address learning loss. Already, every state has signaled their spending, including:
- Hosting summer reading and math camps, or building intensive summer school programs Toppo, 2021Peering 30 Years into the Future, Economists See Lost Earnings for the Pandemic Generation of StudentsView source →
- Promoting “learning acceleration”
- Investing in online softwares for intensive programming
- Establishing “evidence-based” programs for academic needs
- Growing professional development programs centered on increasing reading and math achievement scores
- Creating new screening measures to find what students understand
- Piloting new alternative assessment models to survey additional data
- Expanding afterschool programs to meet academic needs Although many states are importantly investing in social-emotional well-being and trauma-informed learning, almost every budget centers additional testing and training. Unsurprisingly, these initiatives are aligned with new and existing offerings by testing and tutoring companies who will profit from their manufactured learning loss catastrophe.
What Does the New Year Hold?
Without pushback, we find ourselves faced with an educational landscape centered on even more testing and deathly boring instructional models. Students and educators are already familiar with the plethora of tests at the end of the semester and year, which will now be supplemented with additional benchmark, pre- and post- tests, and adaptive learning softwares that take away from classroom educational time.
We know that a focus on standardized test scores leads to anxiety, boredom, a lack of inquiry-based learning, inequitable outcomes, loss of creativity, and students being pushed out of school. Not to mention, this is assuming all of these tests actually measure something meaningful. How do we know that these scores mean anything to begin with?
All-in-all, our focus on recovering “learning loss” makes no sense in the coming year. Many things were lost to the pandemic, much of it unrecoverable. Over 600,000 lives and counting have been lost to COVID, our personal relationships and mental health have been pushed to extremes, and our institutions – including education – struggled to respond in ways that centered human life and well-being. Some students likely struggled academically (and some achieved more.) But a focus on increasing a pitifully small test score differential is not going to solve any of these problems: it will make them worse. By feeding our finances and time to this industry, we will create classrooms of death that will destroy any chance of us reimagining and rebuilding our classrooms in the fall. We must consider the dangerous implications of what we focus on next year, how we implement change, and what this will all look like for students and educators.
Further Reading
How Test Publishers Are Poised To Profit From Pandemic “Learning Loss” by Akil Bello
The Ridiculousness Of Learning Loss by John Ewing
Students Respond to Adults’ Fixation on ‘Learning Loss’ by Larry Ferlazzo
And a similar concept, The Suicide Wave That Never Was by Tom Bartlett